Meet Nanofluids.
Sunlight passes through a shallow layer of clear water, carrying energy out the other side. How could we capture more of that energy as heat? One approach is to suspend tiny, light-absorbing particles in the water. The resulting mixture is a nanofluid.
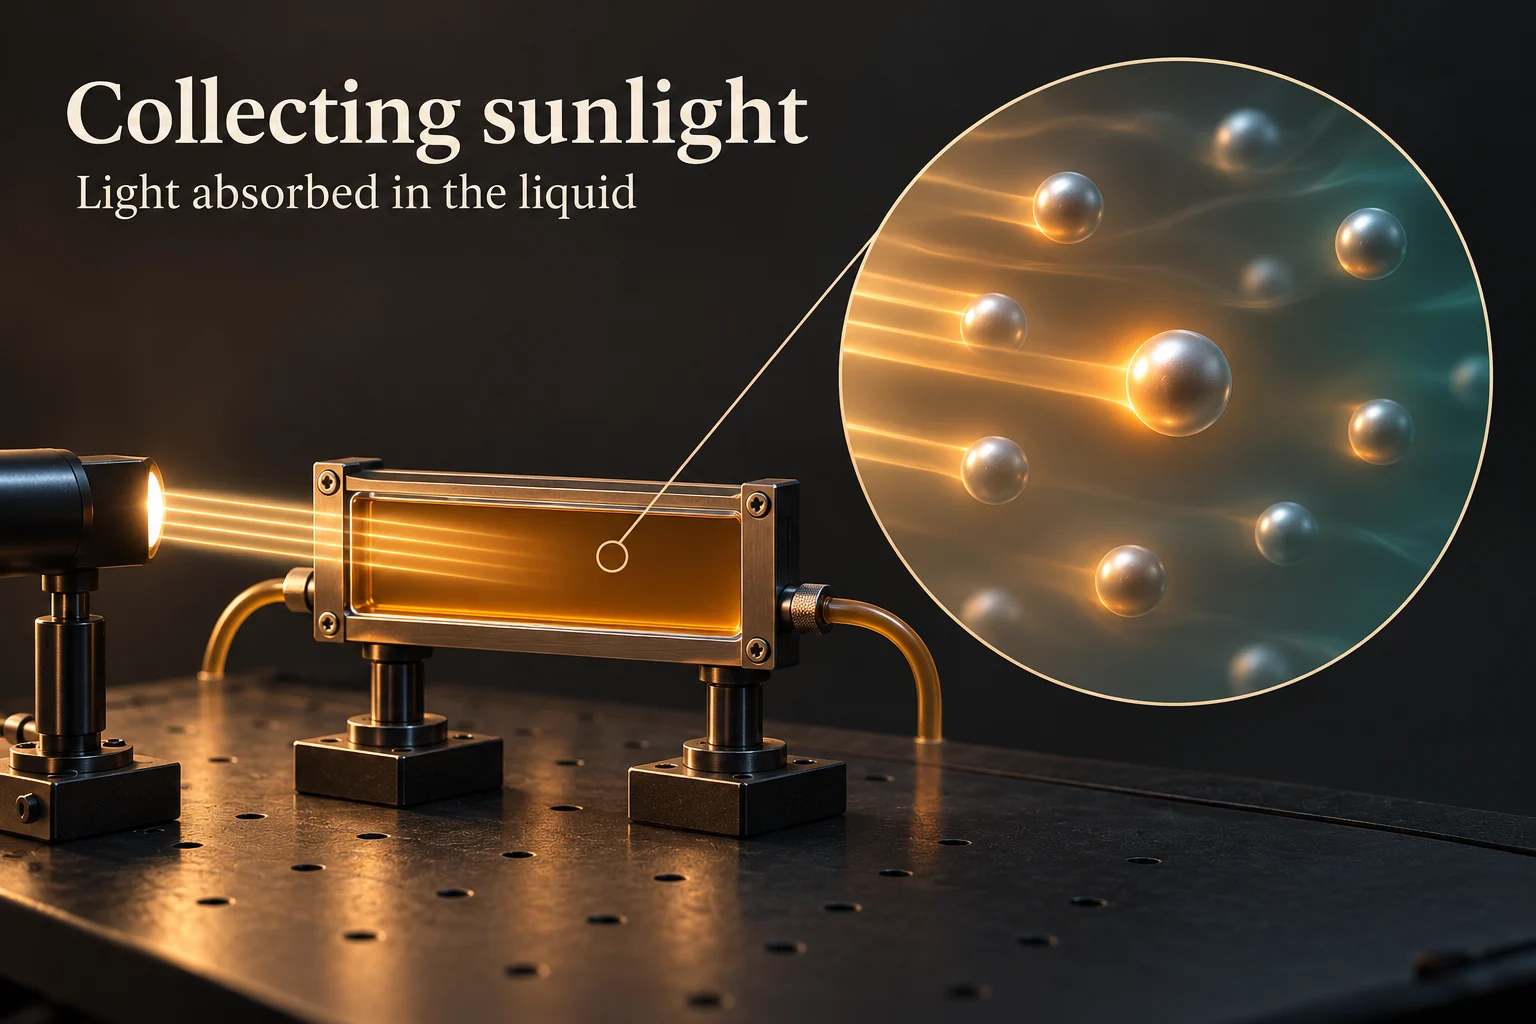
What makes the liquid a nanofluid?
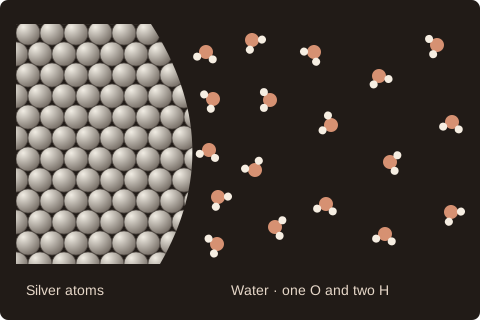
A nanofluid has a liquid that flows and tiny solid particles dispersed through it. In our drop, the liquid is water and the solid is silver. A silver particle four nanometres across is only four millionths of a millimetre wide. It still has an inside and a surface.
Researchers have tested this idea in solar collectors using silver, graphite and carbon nanotubes. Our work starts one step closer in. Once a silver particle is warm, how does its energy reach the water touching it?
Water molecules continually move past that surface. The boundary where water and silver meet is called the interface. To understand why a small amount of silver can put so much water near an interface, first change the size of the particles.
Same silver. How much surface?
Imagine exchanging one sphere for eight smaller ones while keeping every bit of silver. Each new sphere is half as wide. Each has one quarter of the original surface area, so eight together expose twice as much surface to water.
Try the diameter controls. The extra surface is the reason to care about size: it gives more liquid a place to meet the solid, even though the amount of silver stays the same.
What can a vial tell us?
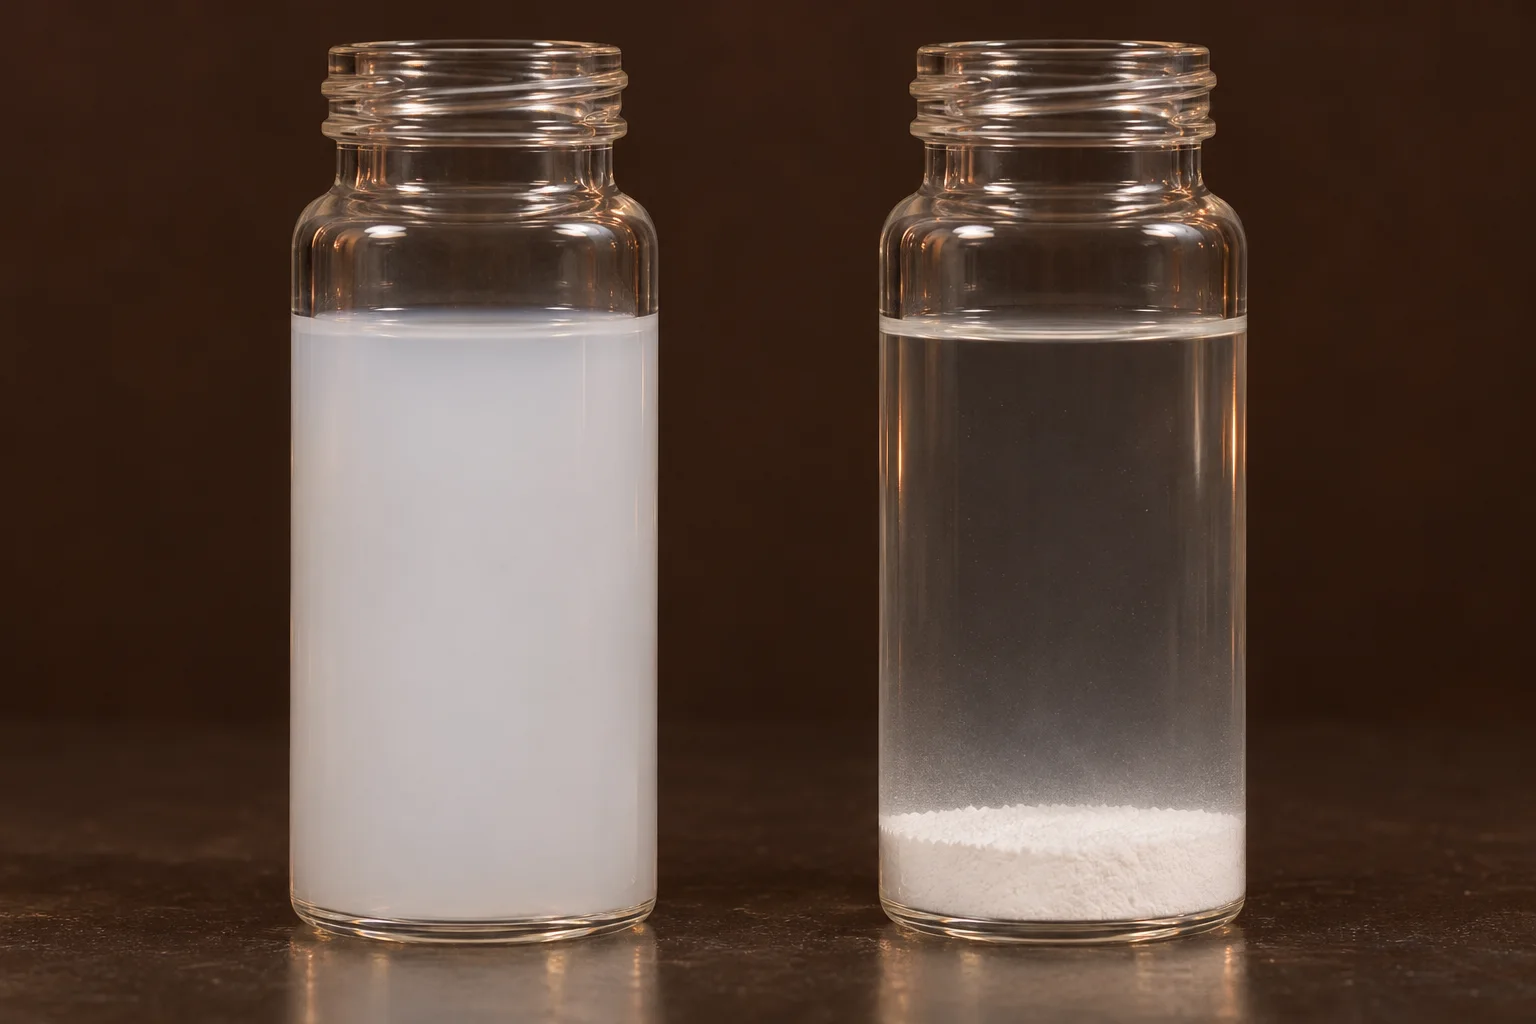
Leave the drop’s parent sample on the bench. If particles collect at the bottom, a drop taken from the top will contain less solid. Even in a cloudy sample, some grains may be touching. Only the surfaces accessible to water count in our surface-area argument.
A vial can reveal settling. To find out how water packs around a single grain, we need a different view. In our simulations we followed the atoms over time and sorted the water by its distance from the silver.
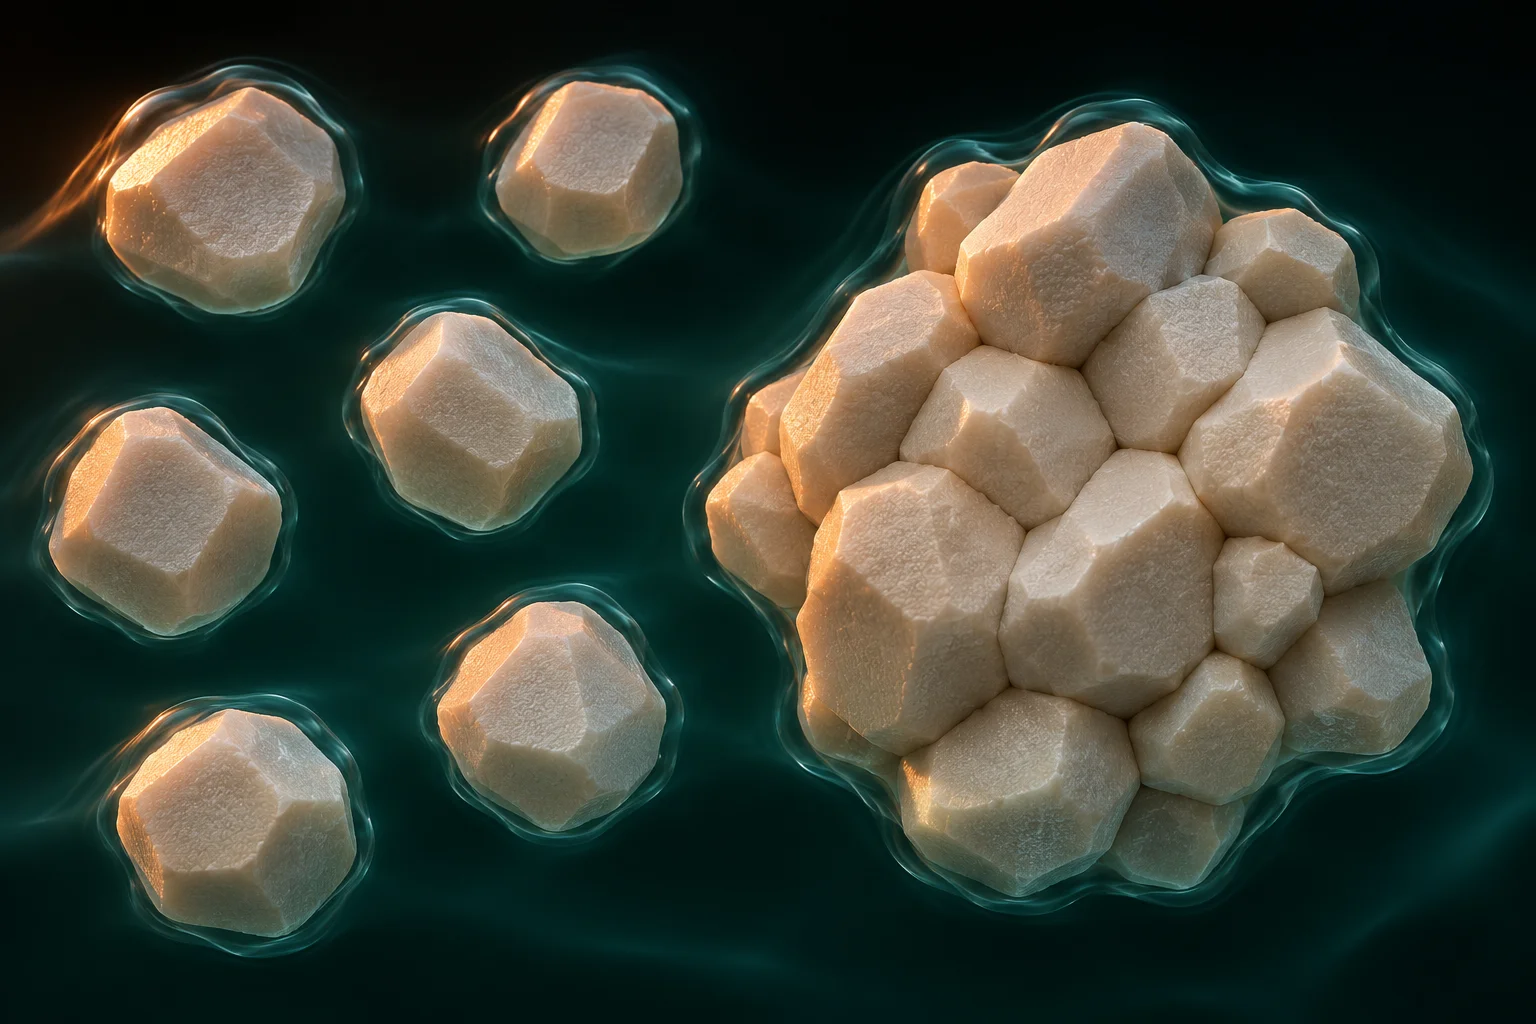
Count the water, one shell at a time.
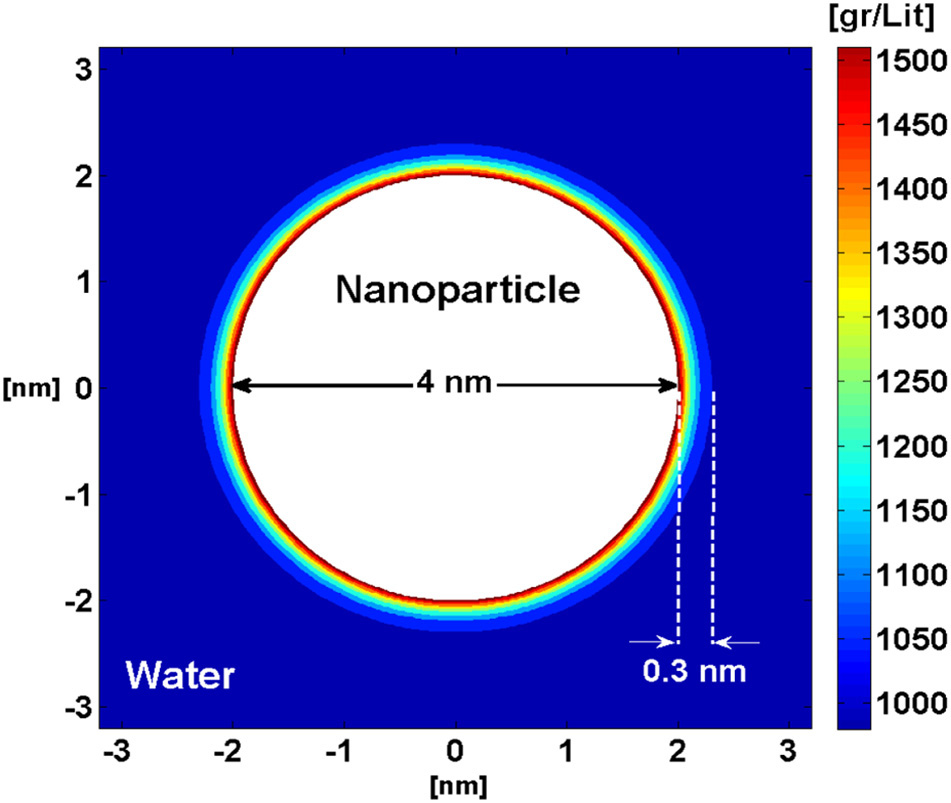
Picture an onion cut through its centre. Around the silver, imagine thin spherical shells like the onion’s layers. These are measuring regions. A water molecule can leave one shell and enter another.
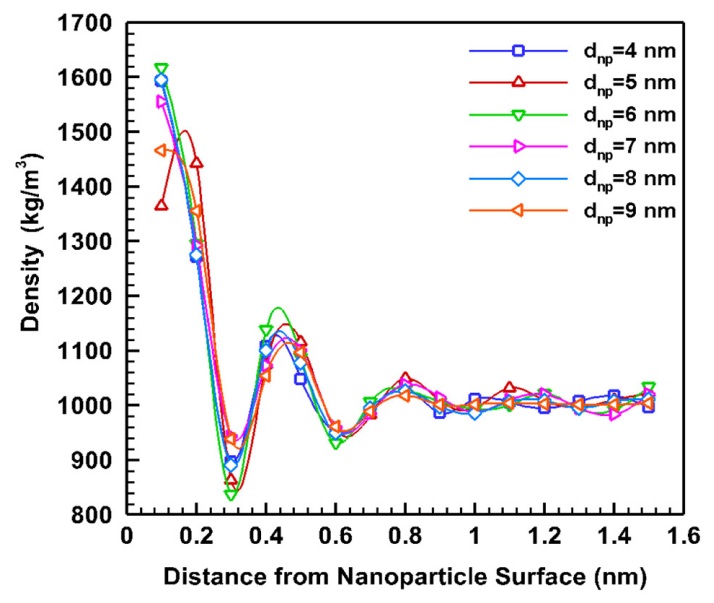
An outer shell takes up more space than an inner shell of the same thickness. To compare them fairly, divide the water mass in each shell by that shell’s volume, then average over time. The result is local density. In our silver simulations, the first peak marks a region where water packs more closely than it does farther away.
Can that thin layer matter to the drop?
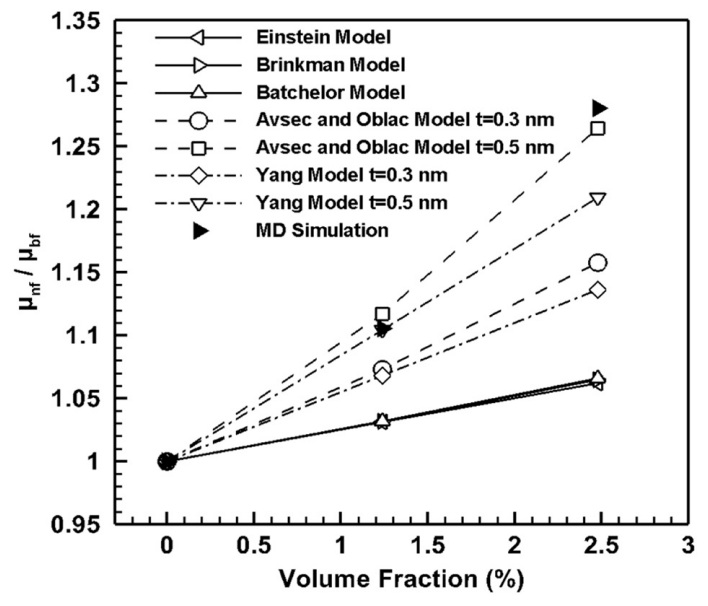
A balance gives the mass of the whole drop. Dividing by the drop’s volume gives its average density. The shell measurement asks the same question about a much smaller region. In our silver study, giving the nearby water its own density improved the estimate for the mixture.
Now imagine two layers of liquid sliding past each other. Viscosity describes how strongly the liquid resists that motion. In the figure, compare models that count just the solid with models that include water near its surface. The filled triangles are the values from our simulations.
Give the silver a pulse of heat.
So far, we counted molecules while the mixture was at uniform temperature. Now imagine warming just the silver and letting it cool. Where would you look for the first sign of that energy in the water?
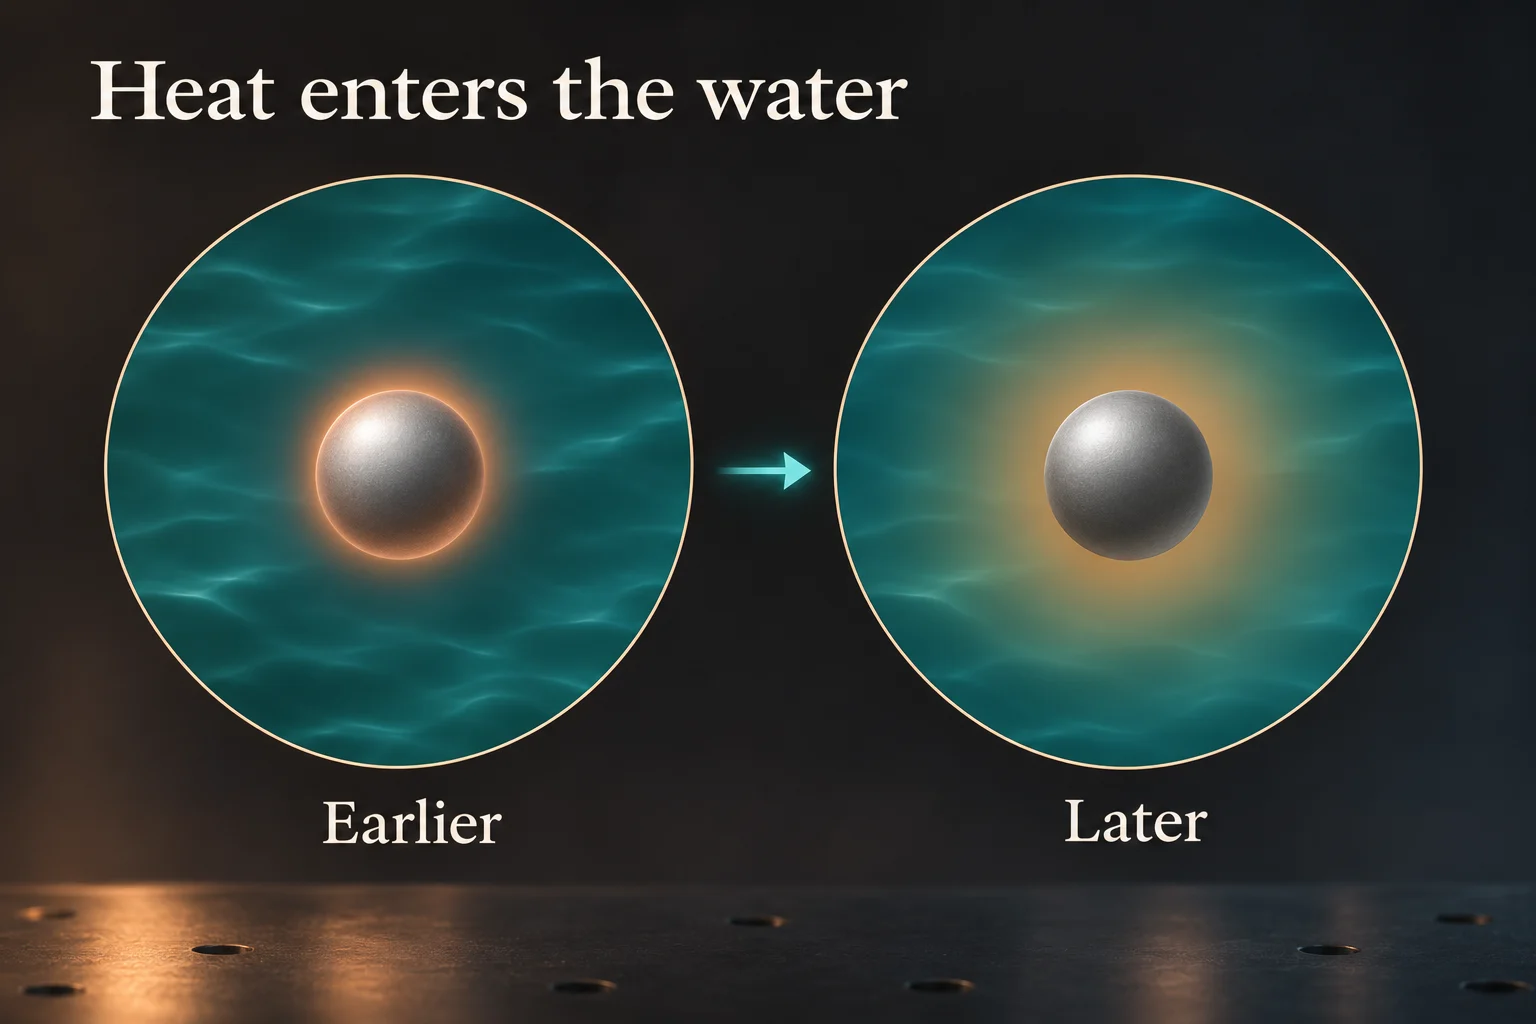
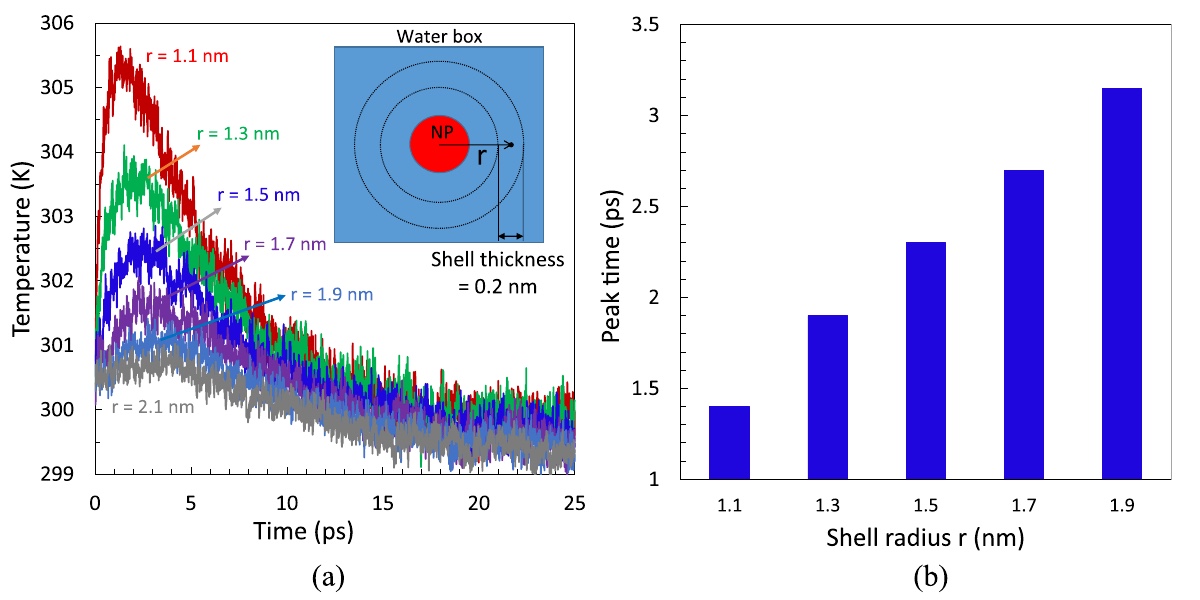
We used the same idea of concentric shells in a separate study, this time tracking molecular motion to estimate each shell’s temperature. The water closest to the silver warmed by about 5 K before cooling again. Farther shells showed a smaller, later peak. A picosecond on the graph is one trillionth of a second.
How does heat cross a particle’s surface?
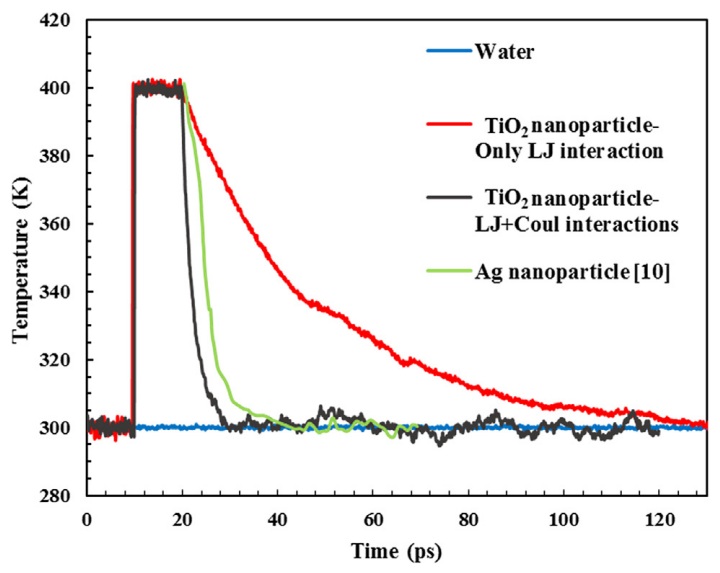
The silver experiment shows where the energy goes. To ask what controls how fast it crosses the interface, we studied titanium dioxide in water. In our model the atoms carry partial electrical charges. We ran the cooling calculation with the electrical forces between the solid and water included, then repeated it with that contribution switched off.
Look at the black and red curves at the same instant. Both particles started hot. The black curve approaches the water temperature much sooner. Interfacial thermal conductance describes how much heat crosses each unit of surface area per second for a given temperature difference. The forces at this surface help explain why the curves separate.
Back to the water at the surface.
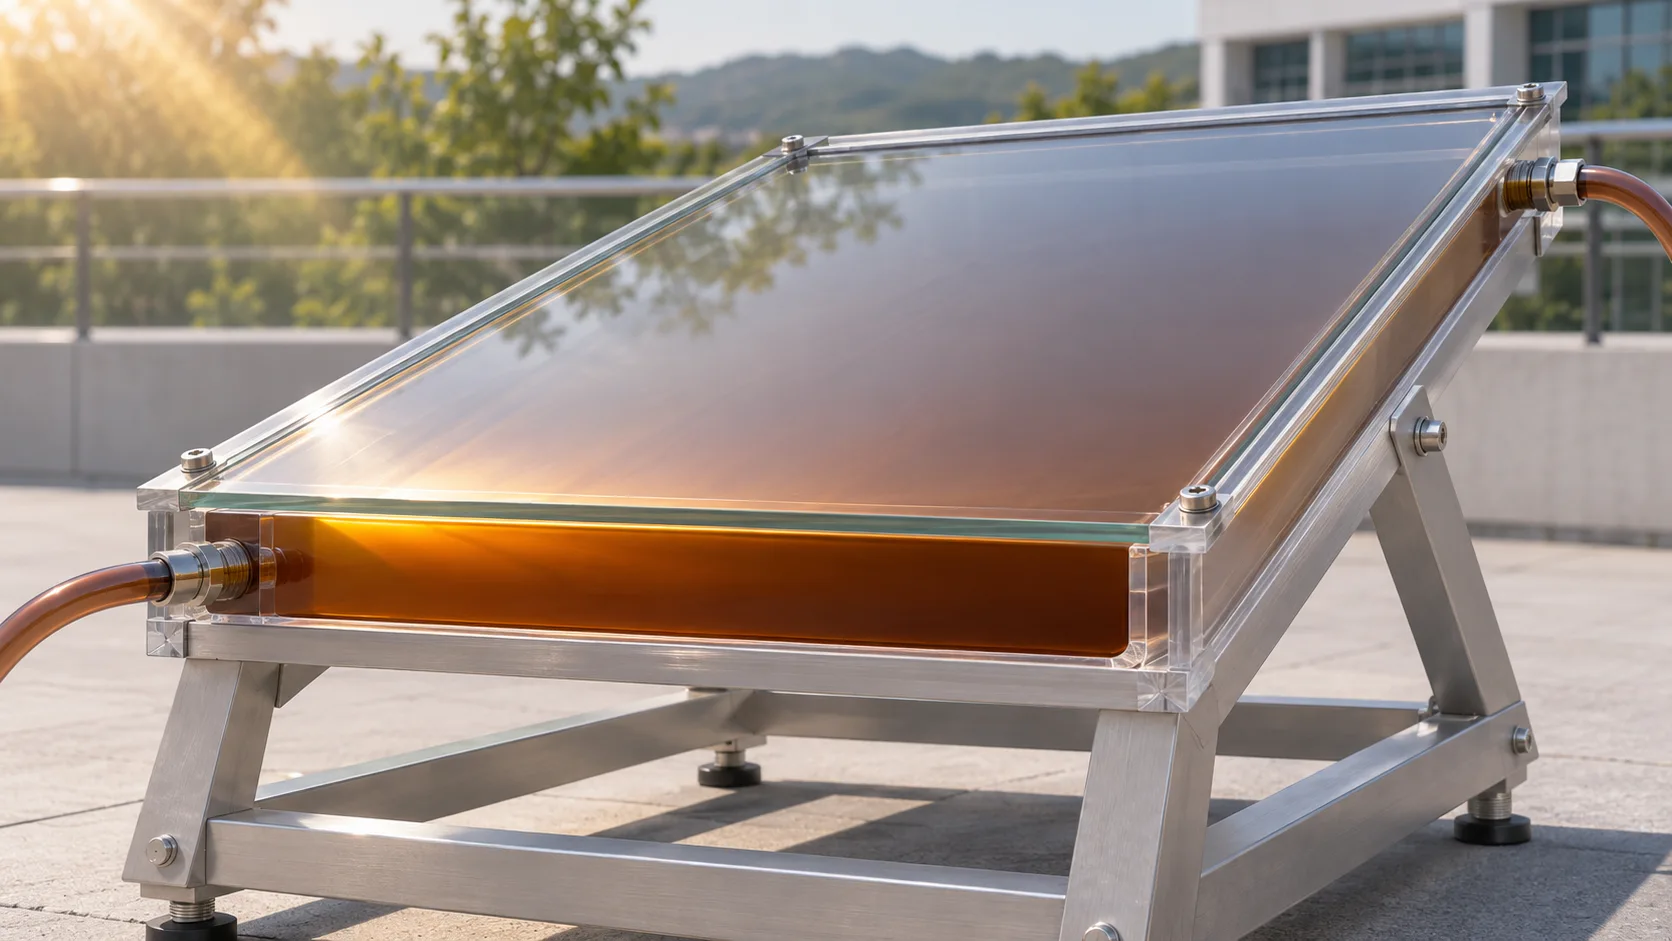
Return to the sunlit collector. Absorbing light is one step. Passing that energy from a particle into the liquid is another. Our simulations let us watch the second step unfold. We could locate water near a surface by measuring its density, then follow a pulse of heat by measuring how the temperature changed at different distances.